
Don’t take my word for it; run it yourself.
Everyone trusts the 200-day moving average.
Almost nobody tests it properly.
Two days ago, the S&P 500 crossed its 200-day moving average, and right on cue, the commentary started. Signals. Regimes. Risk-off. Risk-on. Everyone with a chart sounding the alarm.
It all sounds convincing. Because a backtest on the S&P 500 is a sample of one. One market. One path. One realised history. And it just happens to be the most successful equity index of the last century.
So I ran it properly to see if there was any signal.
Some Background
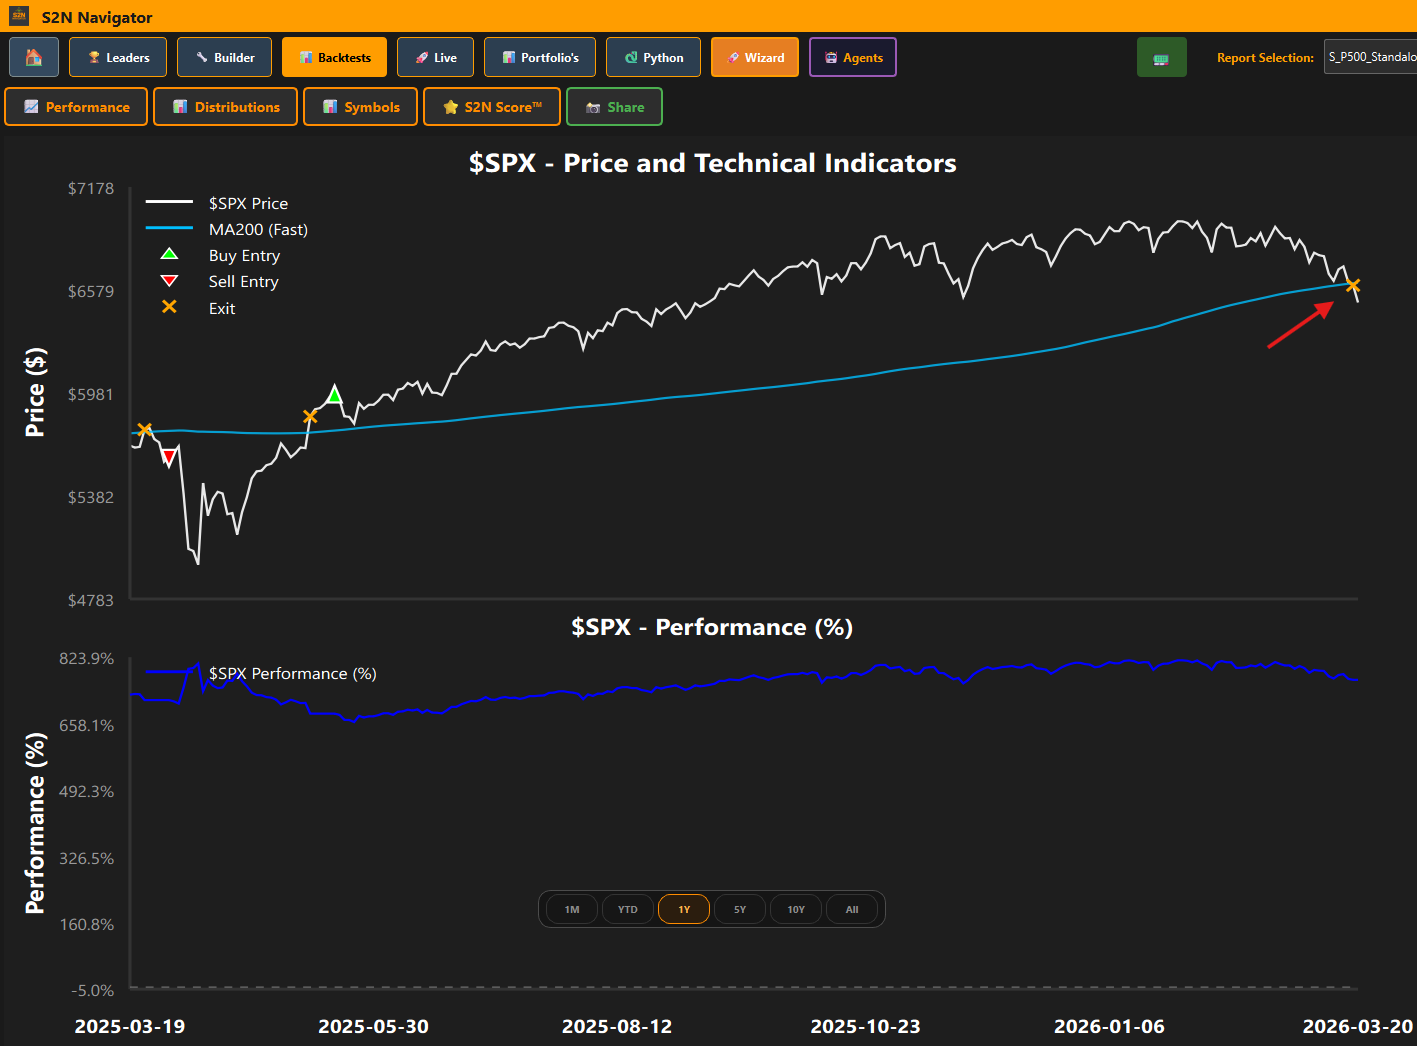
On the 19th of March, 2026, the S&P 500 crossed below its 200-day moving average, and the X community and financial talking heads have all been mentioning it as if it has more powerful predictive abilities than the Sydney weather bureau.
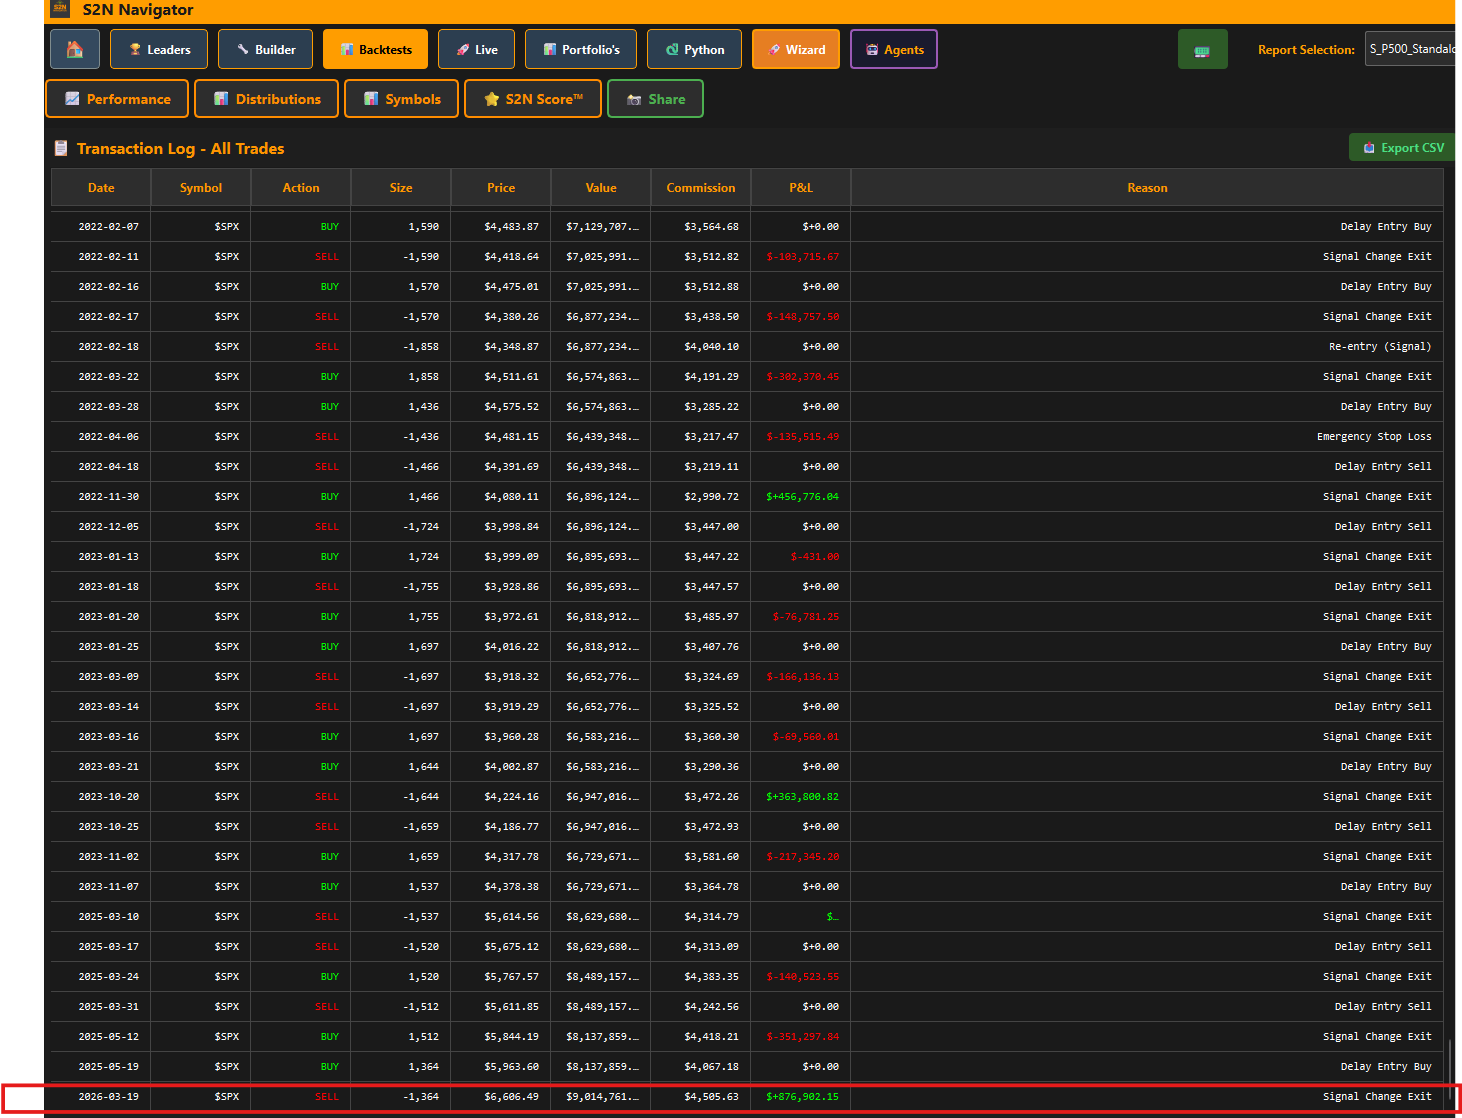
In the chart below, which you can find under Individual Charts in the Symbols menu, you can see that a long trade entered on 2025-05-19 was closed. According to a configuration setting of this strategy, the short will only trigger 5 days after the signal to avoid the typical whipsawing that happens during a signal transition.
You can go to the “Transaction Log” under the “Performance” menu to see the details of the trade.
The Indicator Test
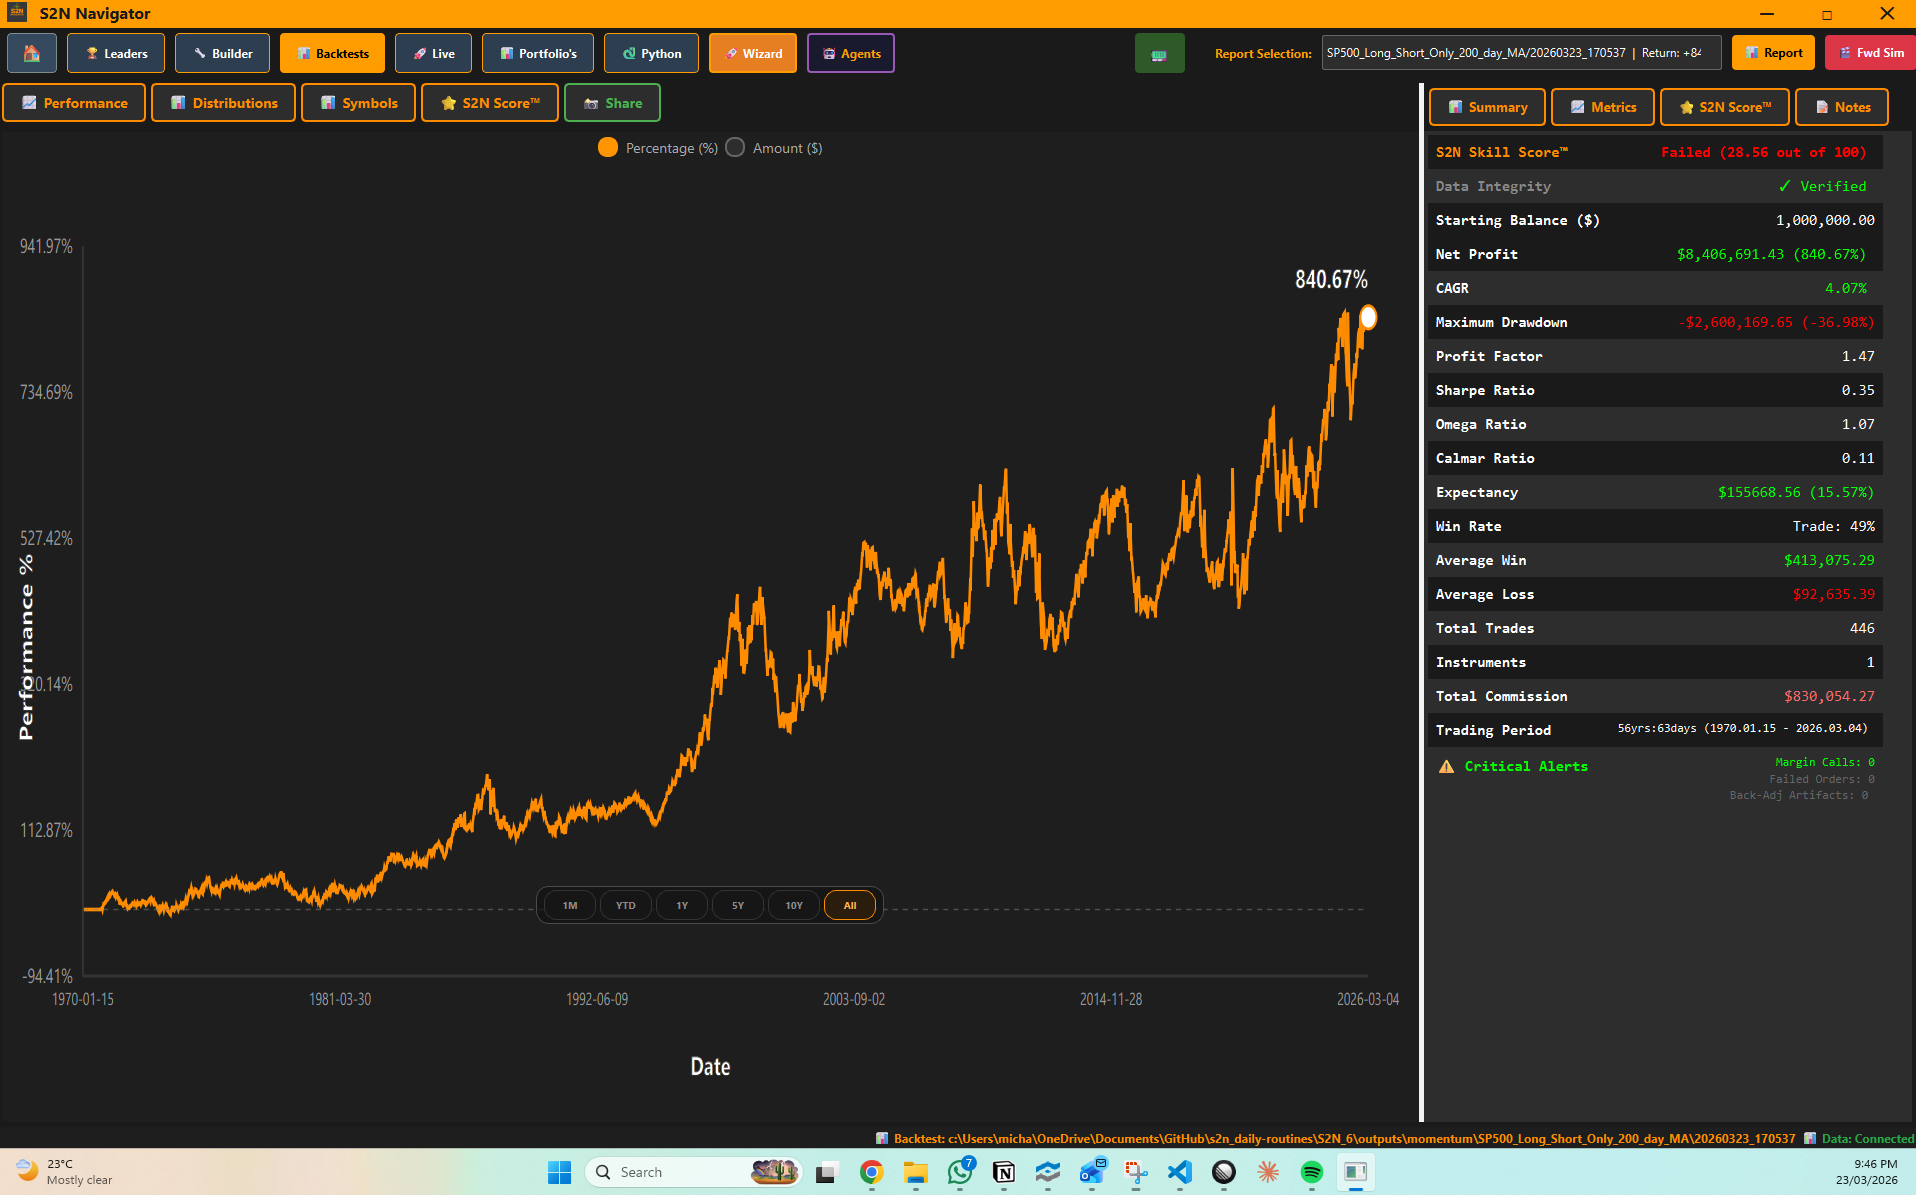
I am going to present the backtest report for a long/short strategy that trades when the S&P 500 is above or below its 200-day simple moving average to see whether it adds any value.
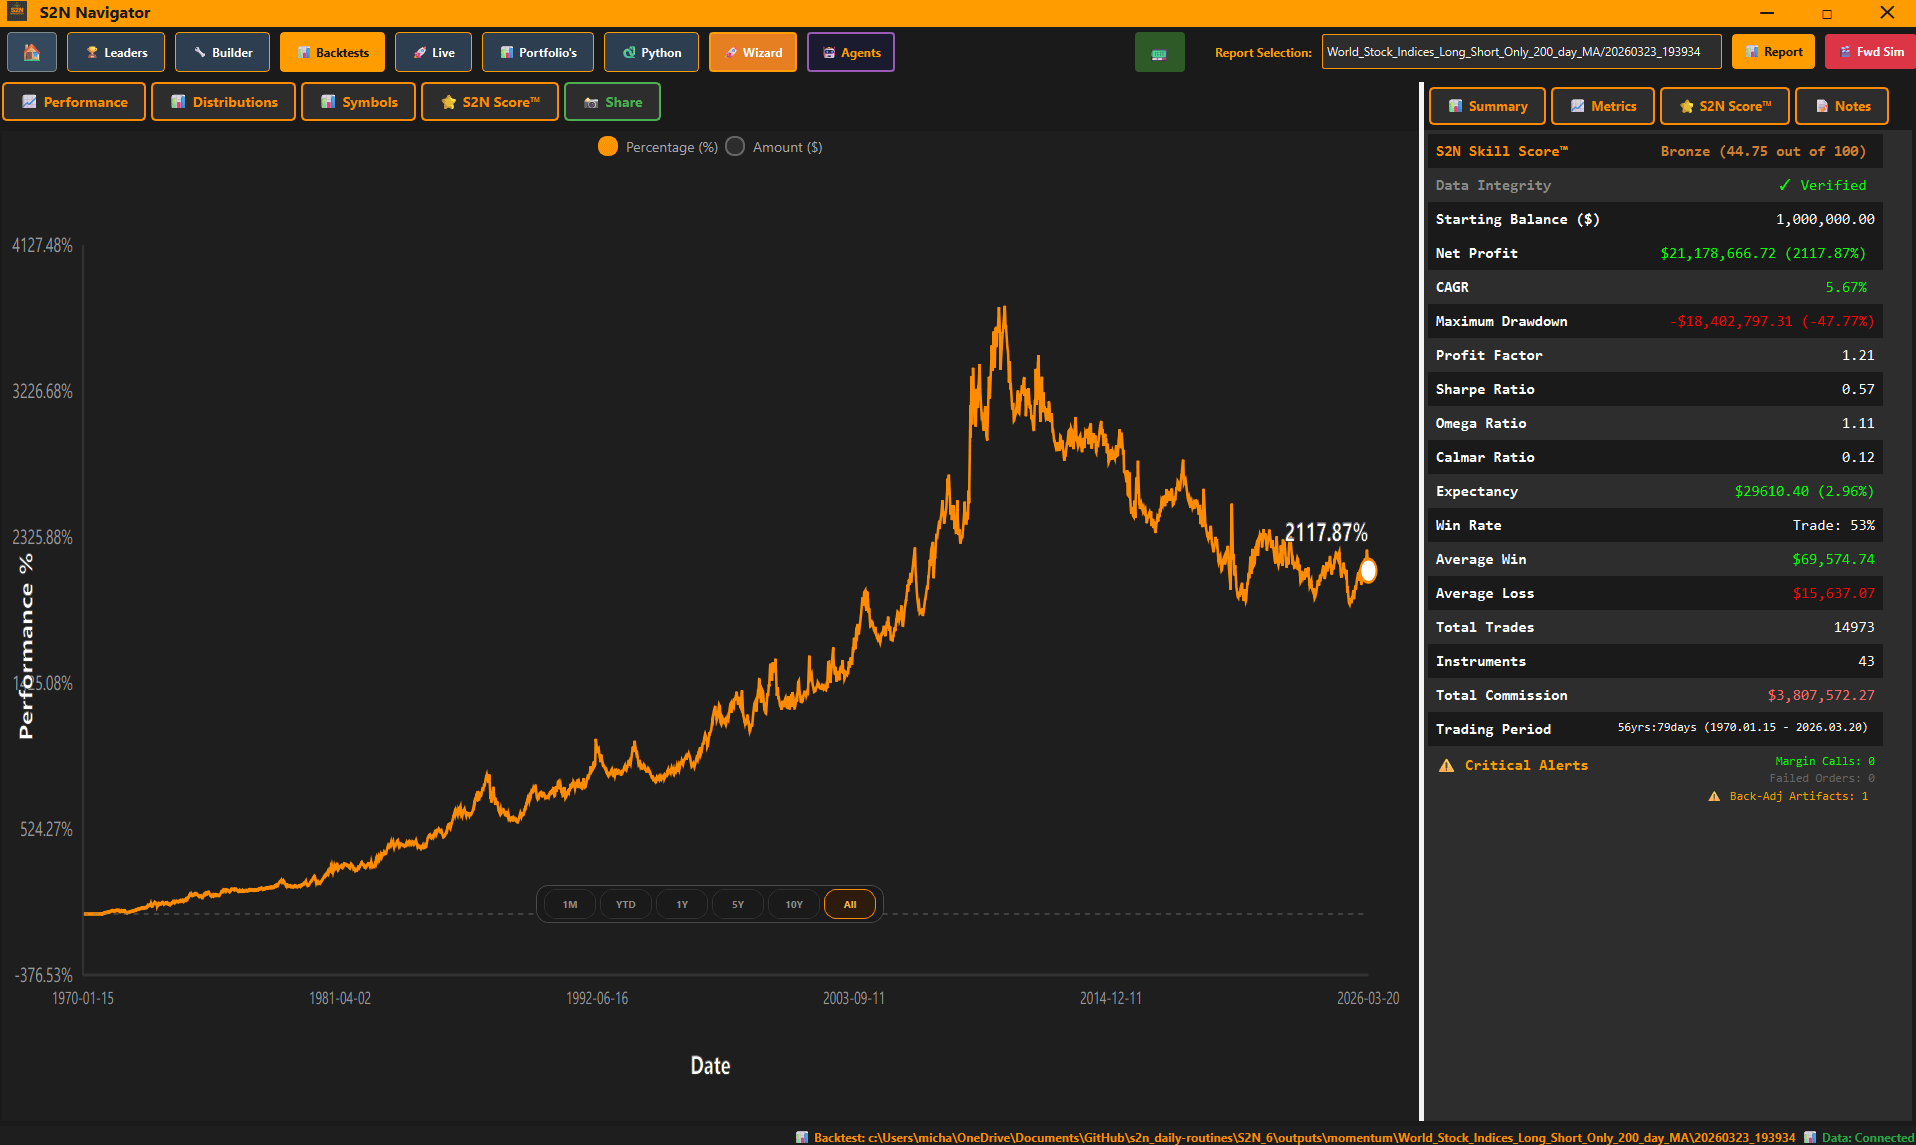
What you see below is a 56-year equity curve of the strategy. As you can see, the S2N Score marks it as a fail.
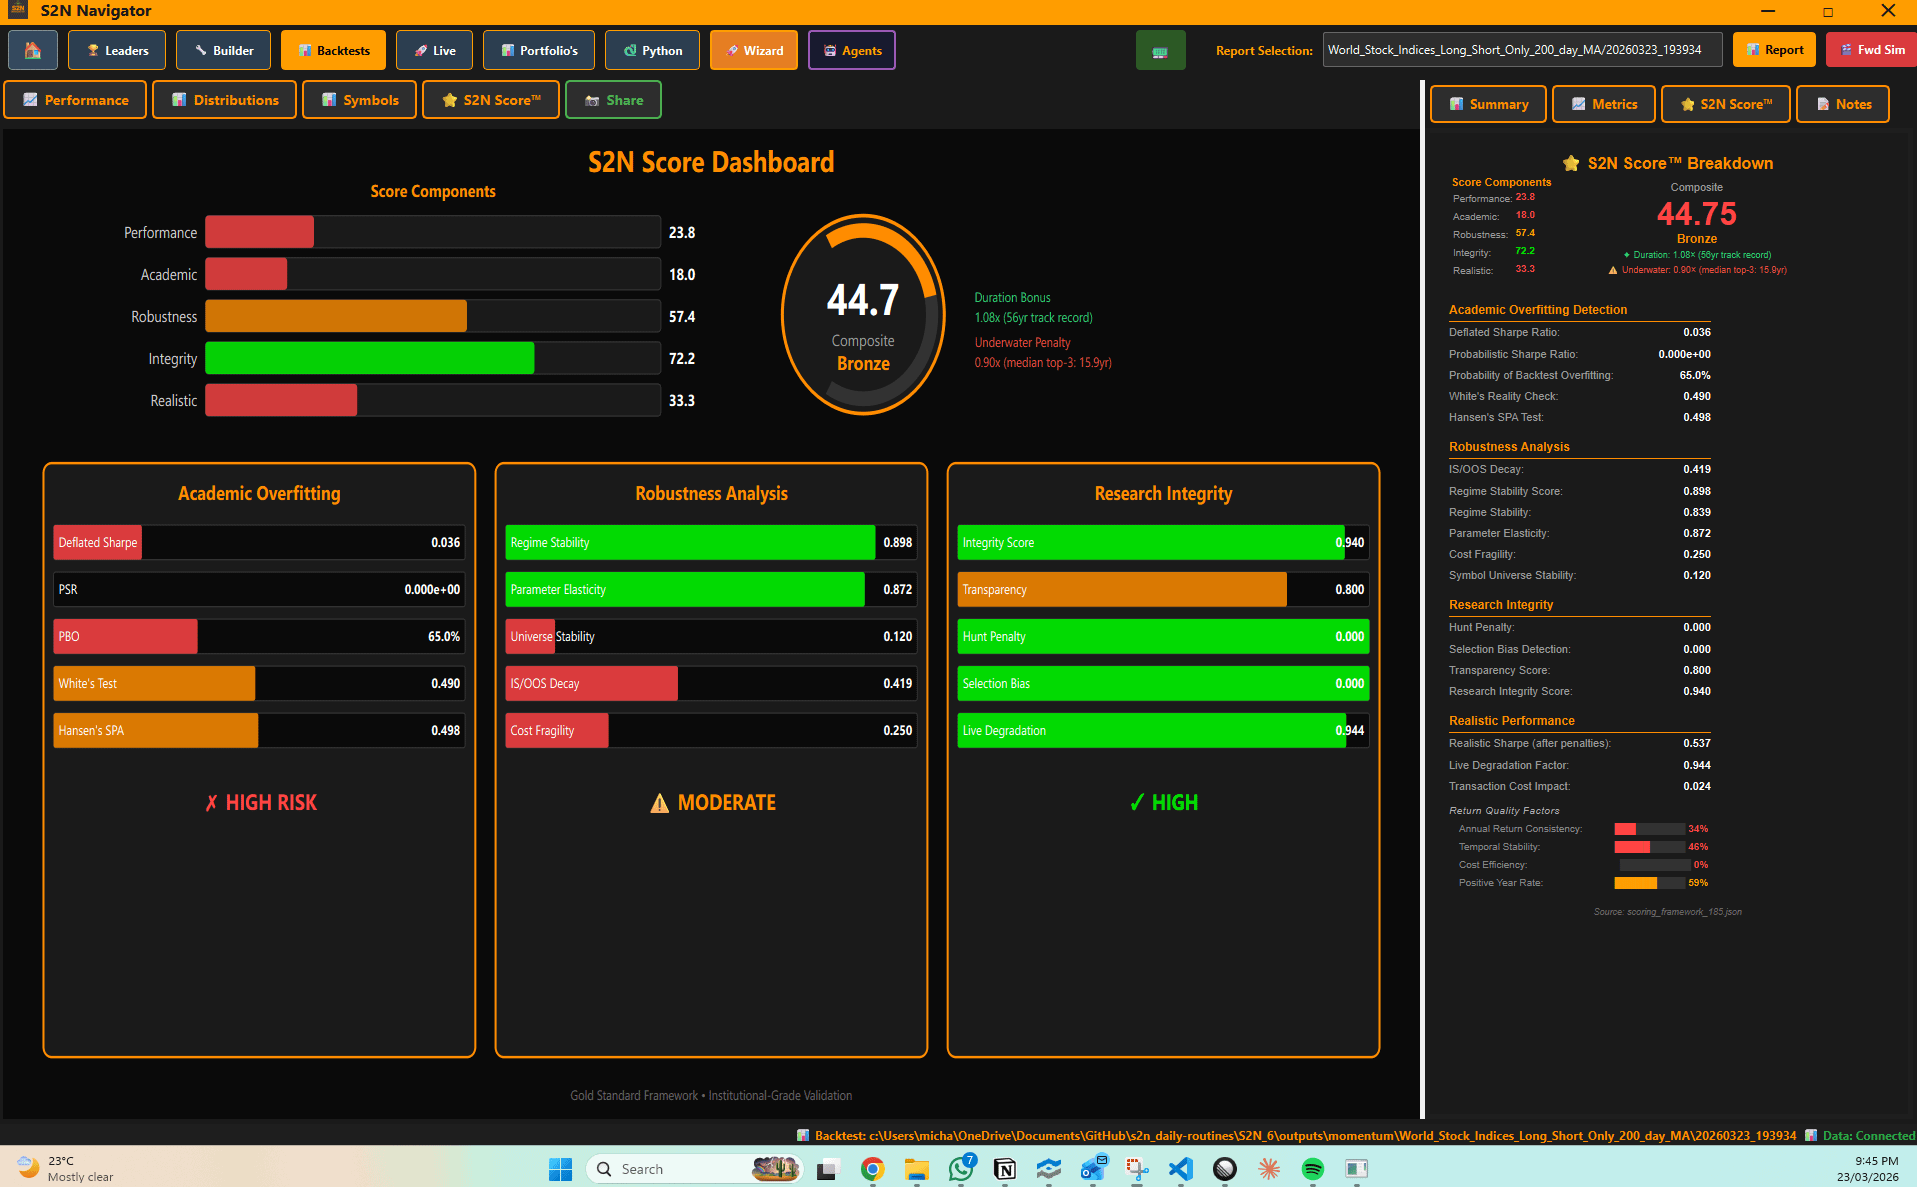
This is a more detailed view of the S2N Score with all its various component parts. Now is not the time to go into each one individually. The point is simple: this is not a strategy you would want to trade as it stands. But there is more.
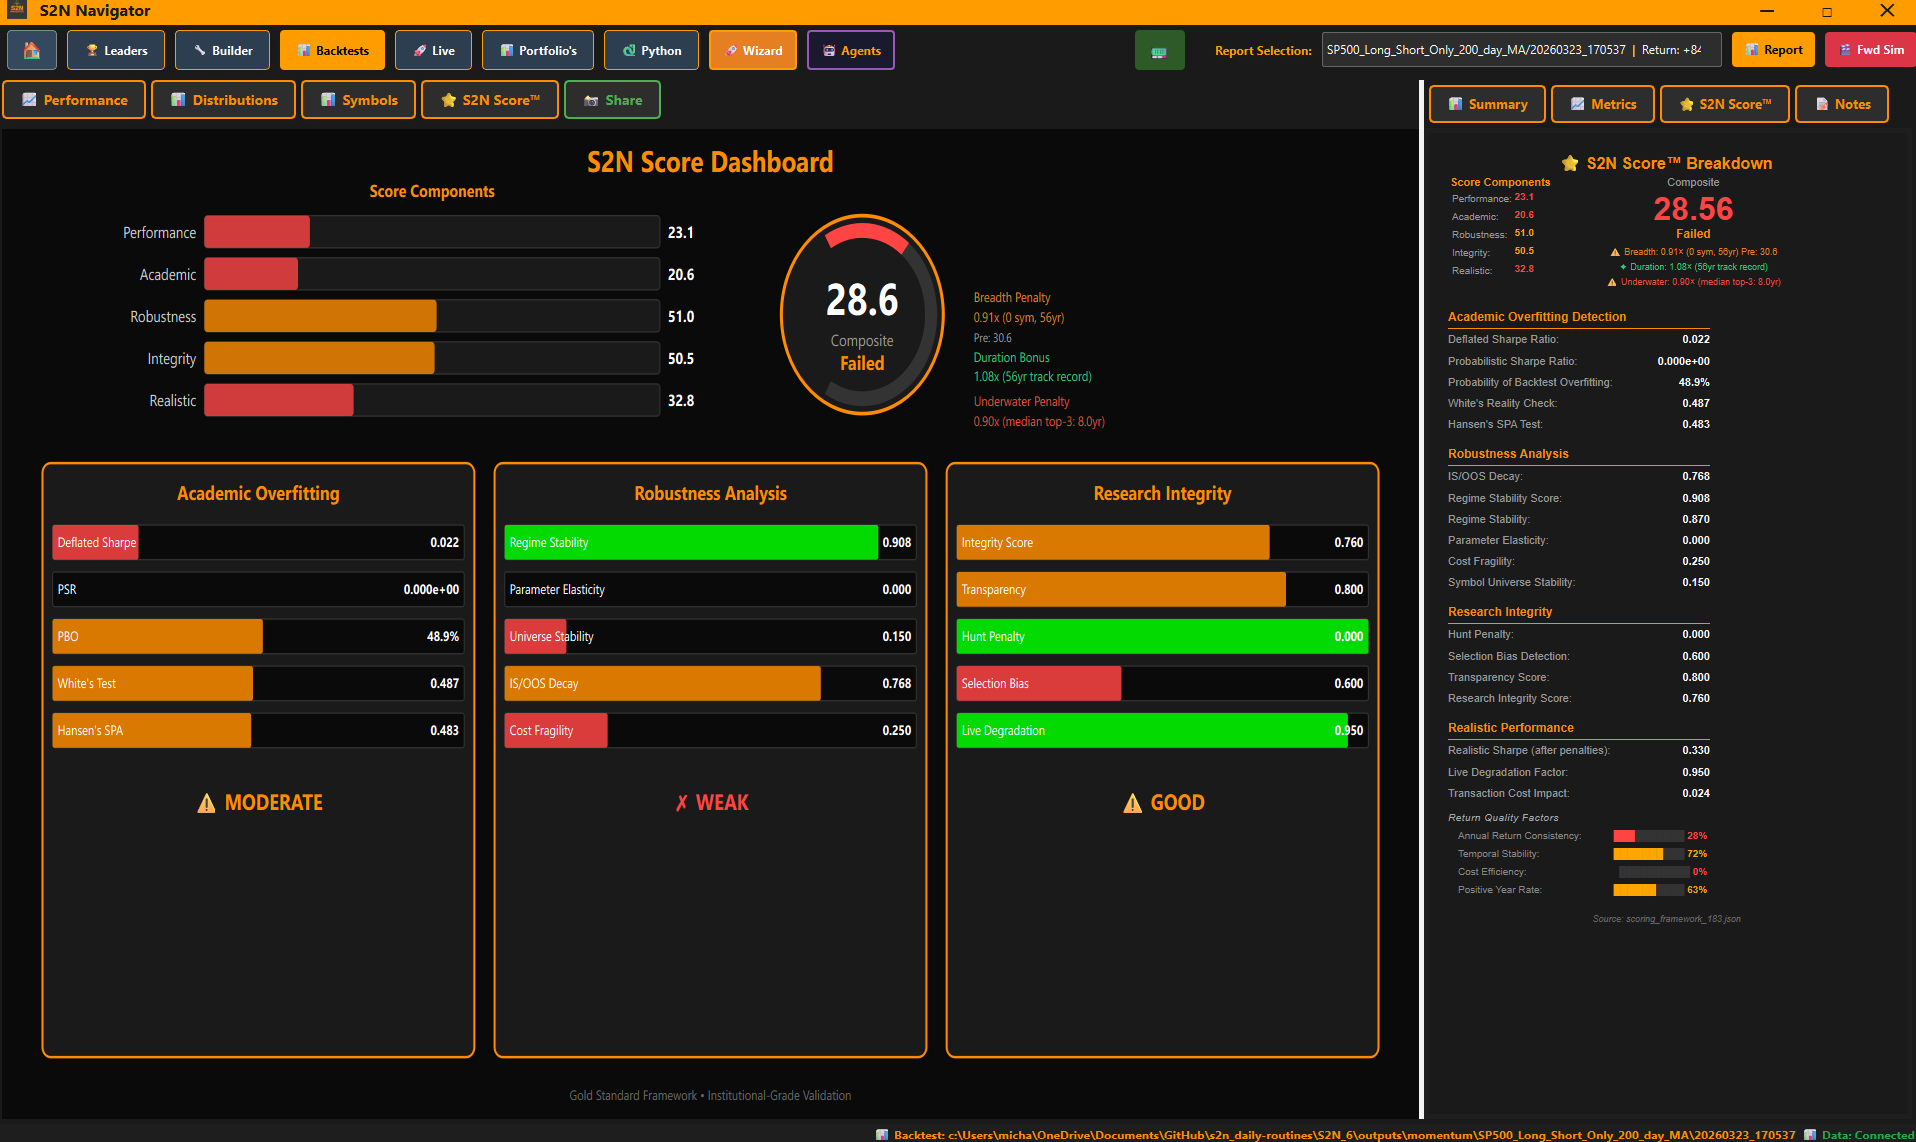
By now you will start to realise that the S2N Score is focused on robustness through time and breadth.
If there is one thing nearly 30 years of active trading has taught me, strategies and traders that have survived a long period of time are robust. Almost always the longer the better.
The other thing that the market has taught me is that those traders who cherry-pick backtests with one or a few symbols introduce selection bias, which inevitably comes back to kill.
You can cherry-pick one market.
You cannot cherry-pick 43.
What happens when you remove the selection bias and apply the same signal across 43 markets?
The backtest below is the exact same strategy. However, it has been applied to 43 world stock indices instead of just the S&P 500.
As you can see, the total return numbers are completely different, as is the Sharpe Ratio. More importantly, the S2N Score is marking the more diversified portfolio with a bronze medal and a better overall score than the single symbol portfolio.
Concluding Thoughts
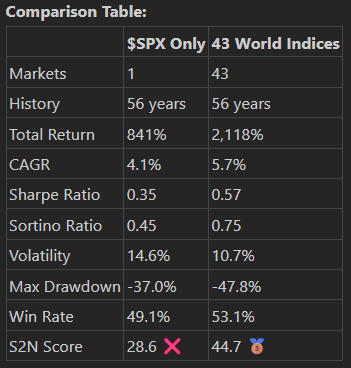
The numbers tell a clear story. Expanding from one market to 43 produces meaningful improvement across nearly every dimension: higher returns; better Sharpe and Sortino ratios; lower volatility; and an S2N Score that climbs from a hard fail at 28.6 to a bronze at 44.7.
The signal is not useless when tested broadly. A 53% win rate across 43 global indices over 56 years is not noise.
But notice what stayed the same. The Probabilistic Sharpe Ratio — the statistical test that asks whether the strategy’s edge is real or a product of luck — is zero in both cases. The 200-day moving average, as a standalone long/short signal, does not produce a statistically distinguishable edge.
One figure in particular deserves attention: the selection bias detection score drops from 1.0 on a single symbol to 0.3 across 43 markets. That number is the S2N Score telling you exactly why the SPX result looked more compelling than it was. One symbol, one market, cherry-picked history. You cannot cherry-pick 43 markets the same way.
The drawdown worsening as you add markets from -37% to -48% is also worth noting. In normal conditions, 43 indices are diversified. In a genuine global crisis, correlations collapse towards one, and the signal can be wrong everywhere simultaneously. Breadth is not the same as downside protection.
The dangerous illusion the headline refers to is not that the 200-day moving average never works. It is that a backtest on the world’s most-watched equity index will always look credible enough to be convincing and give those who are paid for noise something to sell. Without a framework built to stress-test robustness across time and breadth, there is no reliable way to know you are looking at an illusion.
This is exactly why I built the S2N Score inside Navigator.
Don’t take my word for it; run it yourself.